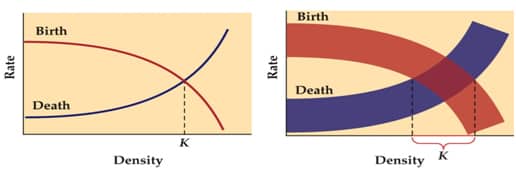
Population size changes as a result of four processes: Birth, death, immigration, and emigration.
- Nt = Population size at time t

- B = Number of births
- D = Number of deaths
- I = Number of immigrants
- E = Number of emigrants
Individuals can move from one population to another, and population size can change from one time period to the next.
Population dynamics: The ways in which populations change in abundance over time.
Populations exhibit a wide range of growth patterns, including exponential growth, logistic growth, fluctuations, and regular cycles.
These four patterns are not mutually exclusive. A single population can experience each of them at different times.
Exponential Growth
- Population increases by a constant proportion at each point in time.
- When conditions are favorable, a population can increase exponentially for a limited time.
- Species such as the cattle egret colonize new regions by long-distance or jump dispersal events.
- Local populations then expand by short-distance dispersal events.
Logistic Growth
- Some populations reach a stable size (equilibrium) that changes little over time.
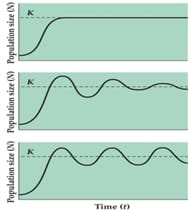
- These populations first increase, then fluctuate by a small amount around the carrying capacity.
- Plots of real populations rarely match the logistic curve exactly.
- “Logistic growth” is used broadly to indicate any population that increases initially, then levels off at the carrying capacity.

Population Fluctuation
- In all populations, numbers rise and fall over time.
- Fluctuations can be erratic, or deviations from a growth pattern, e.g., the Tasmanian sheep population.
- Sometimes the number of individuals can increase rapidly, causing a population outbreak.
Population Cycles
- Some populations have alternating periods of high and low abundance at regular intervals.

- Populations of small rodents, such as lemmings and voles, typically reach a peak every 3–5 years.
- Delayed density dependence: Delays in the effect that density has on population size.
- Delayed density dependence can cause populations to fluctuate in size.
- Predators vs. Prey lag delay. The population of predator growth will lag behind that of the prey.
At intermediate levels, (0.368 < rτ < 1.57), damped oscillations result.
When rτ is large (rτ > 1.57), the population fluctuates indefinitely about the carrying capacity. This pattern is called a stable limit cycle
Population Extinction
- The risk of extinction increases greatly in small populations.
- Fluctuations in growth rate, population size, and chance events can affect a population’s risk of extinction.
- The geometric growth equation can include random variation in the finite rate of increase (λ).
- Random variation in environmental conditions can cause λ to change from year to year (good years and bad years for growth).
- When variable environmental conditions result in large fluctuations in growth rate, the risk of extinction increases.
- Small populations are at the greatest risk.
- If the simulations are repeated using larger initial population sizes, there are fewer extinctions.
- Demographic stochasticity—chance events affect the survival and reproduction of individuals.
Allee effects: At low densities, individuals have difficulty finding mates, so growth rate decreases as population density decreases.
Allee effects can reduce small population size even further.
Environmental stochasticity: Unpredictable changes in the environment that can cause extinction of small populations.
Environmental stochasticity—change in average birth or death rates from year to year because of random changes in environmental conditions.
Demographic stochasticity—birth and death rates are constant, but the actual fates of individuals differ.
Natural catastrophes (floods, fires, etc.) can eliminate or greatly reduce even large populations, and play a role in extinctions.
Metapopulations: For many species, suitable habitat exists as a series of spatially isolated patches, resulting in isolated populations. (So some of isolated populations may go extinct but the species continues to live on in other patches)

Extinction and colonization of patches (Levins 1969, 1970):
- p = Proportion of habitat patches occupied at time t

- c = Patch colonization rate
- e = Patch extinction rate
The equation makes several assumptions:
- There is an infinite number of identical habitat patches.
- All patches have an equal chance of receiving colonists.
- All patches have an equal chance of extinction.
- Once a patch is colonized, its population increases to carrying capacity faster than colonization and extinction rates (allows population dynamics within patches to be ignored).
Levins’ research impacts key issues:
- Factors that influence patch colonization and extinction.
- Importance of the spatial arrangement of patches.
- How the landscape between patches affects dispersal.
- Whether empty patches are suitable habitat.
- Habitat fragmentation: Large tracts of habitat are converted to isolated patches, resulting in a metapopulation structure.
- As patches get smaller and more isolated, colonization decreases, and the extinction rate increases.
- If e/c becomes >1, the metapopulation will go extinct.
- Real metapopulations often violate the assumptions of Levin’s model.
- Patches vary in size and ease of colonization; extinction and colonization rates can vary greatly among patches.
- More complex models are now used.
- Research on skipper butterflies in the United Kingdom highlighted two important features of metapopulations:
- Isolation by distance—when patches are too far apart.
- Patch size—small patches may be hard to find and have high extinction rates.
- Isolation by distance can affect the chance of extinction—a patch that is near an occupied patch may receive immigrants repeatedly.
- High rates of immigration that protect a population from extinction are known as the rescue effect.
- Bottom-up control—increased nutrient inputs caused eutrophication and increased phytoplankton biomass, decreased oxygen, fish die-offs, etc.
Top-down control—top predators control the abundance of populations
