Introduction
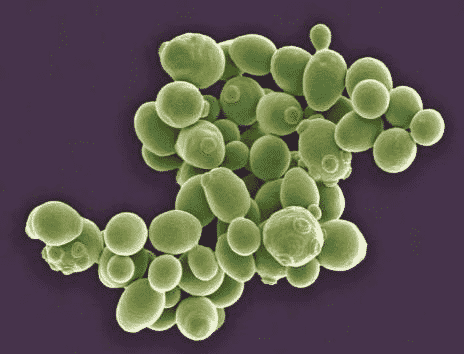
Yeast is commonly known as a baking material for making bread and beer. However, under biological jargon it is a group of eukaryotic, single-celled microorganisms that makes up almost 1% of all fungal species.1 They are found in soils and on plant surfaces, like flower nectar and fruits, and they reproduce asexually through budding. This is where a small daughter cell grows on the parent cell whose nucleus then duplicates and then separates with the daughter cell. This reproduction can happen at a rate of up to once every 90 minutes.2 However, some yeast is an exception and reproduces by binary fission, a process in which the DNA duplicates and the cytoplasm splits evenly into two identical daughter cells.
Most importantly, yeast undergoes metabolism without the presence of oxygen, thus respiring anaerobically. The carbon dioxide that is produced is what makes bread rise when using the specific type; Saccharomyces cerevisiae, also known as baker’s yeast.
The breakdown of glucose by yeast:
C6H12O6 → 2C2H5OH + 2CO2
Glucose → ethanol + carbon dioxide
The glucose is broken down by glycolysis. However, there is more to the process than this simple arrow. When respiring anaerobically, yeast performs glycolysis where it converts pyruvate further into ethanol and carbon dioxide. Although the process requires 2 ATP, it produces 4; a net gain of 2 ATP molecules that can be used for energy. Fermentation rate is affected by factors like temperature, saccharide concentration, and type of sugar solution.
Monosaccharides are the monomers3 of carbohydrates, consisting of glucose, fructose, and galactose. They provide quick, accessible energy that is easily broken down. Disaccharides are made of two monosaccharides, consisting of lactose, maltose, and sucrose. They are held together by a covalent bond4 through a condensation reaction.5 Thus, their more complex structures make them harder to break down compared to monosaccharides. These are the sugars and the monomers each sugar is made up of.
| Sugar | Sugar Type | Components | Formula |
| Glucose | Monosaccharide | Monomer (none) | C6H12O6 |
| Fructose | Monosaccharide | Monomer (none) | C6H12O6 |
| Sucrose | Disaccharide | Glucose and fructose | C12H22O11 |
| Lactose | Disaccharide | Glucose and galactose | C12H22O11 |
Investigations
2.1 Hypothesis
Glucose will produce the largest amount of carbon dioxide, followed, by fructose, sucrose, and lactose. Although they all have similar chemical formulas, they differ in structure and
stereochemistry.6 The monosaccharides will perform better because they require less energy to be broken down and thus create the product of carbon dioxide at a faster and higher rate.
H: The carbon dioxide produced will be the same for each sugar type.
H1: The addition of monosaccharides will produce more carbon dioxide than disaccharides.
2.2 Variables
Independent Variable: Type of saccharide
Dependent Variable: Time of each observation (minutes)
Controlled Variables:
- Beaker size: 250ml
- Keeping this consistent would allow the same space for each reaction to take place.
- Amount of yeast: 2.0g
- Type of yeast: Alnatura Backhefe
- Ingredients: Yeast dried from organic farming
- This was important to monitor because different yeast that has different origins could have different reactions.
- Amount of distilled water: 50ml
- Maintaining a consistent amount of ingredients ensured that the chemical reactions would have fair, equal environments.
- Amount of saccharide: 5.0g
- Maintaining a consistent amount of ingredients ensured that the chemical reactions would have fair, equal environments.
Uncontrolled Variables:
- Room temperature: 21°C
- This was monitored using a thermometer. This was important to keep consistent because increased temperatures speed up reactions. However, the lab is quite large, so it was impossible to control this variable.
2.3 Preliminary Experiment
A preliminary experiment was carried out a day before our designated internal assessment time. I thought it was appropriate to prepare for my actual experiment to ensure that all the materials were working, and my procedure demonstrates efficacy. My method was identical to that of my real one, however, I did make one change. Originally, my saccharide to distilled water ratio was 5g:100ml. This was not fitting for my time frame of 30 minutes. Thus, I changed my measurements and made the solution much more concentrated; 5g:50ml. This increased the speed of the reaction so I could take more readings within a smaller span of time, allowing me to also improve my reliability.7
In addition to adapting my method, I also conducted a control test. I mixed 2g of yeast with 50ml of distilled water and no carbon dioxide was released. Now that I had a method that worked, I could safely move on to my final internal assessment procedure.
Procedure
3.1 Apparatus
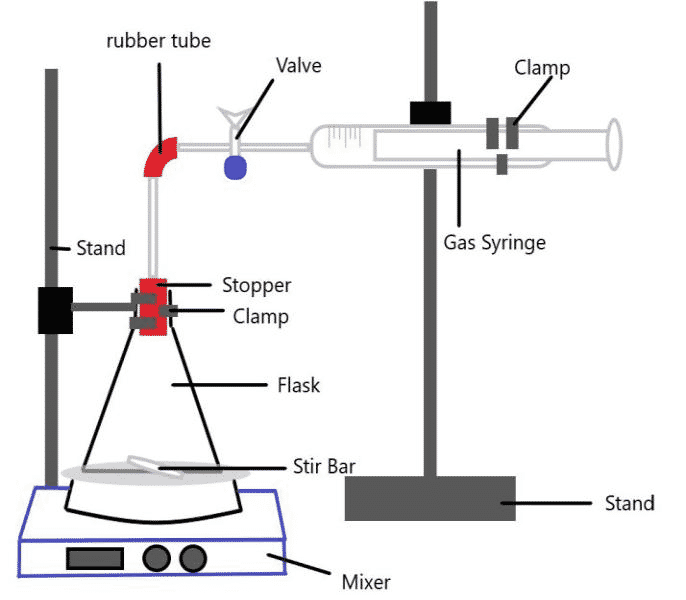
- Gas Syringe – to measure produced carbon dioxide (±0.05ml)
- Mixer – to create and mix the solutions of a saccharide and distilled water
- Stir Rod (or Flea) – magnet used to mix the solutions
- Stands – to hold apparatus in place
- Scale – to measure necessary materials (± 0.05g)
- Stopper – to prevent any carbon dioxide loss throughout the structure
- Clamps – to hold flask and gas syringe in place
- Graduated cylinder – to measure the amount of each ingredient (±0.1ml)
- Flask – to contain the site of the reaction
- Rubber Tube – to connect the glass pipes
- Baking Yeast (Backhafer)
- Glucose, Fructose, Sucrose, Lactose
- Distilled Water – to create solution that is added to yeast

3.2 Methodology
Control:
- Pour 2g of yeast into the flask
- Add 50ml distilled water
- Put mixer on 500 rpm
- Record results at both 15 and 30
- The mixture should not release any carbon dioxide, as there is no respiration.
Saccharide Experiment:
- Mix 5g of the saccharide with 50ml distilled water in a beaker until clear
- Pour 2g of yeast into the flask
- Make sure the valve is open so the carbon dioxide can flow through to the gas syringe
- Pour the saccharide and distilled water solution into the flask
- Immediately close the flask with the stopper
- Immediately start timer
- Put mixer on 500 rpm
- Record results at 15 minutes (from gas syringe)
- Stop timer at 30 minutes and record results
- Clean apparatus between uses
- Repeat 4 times per sugar for each sugar
3.3 Justification
All of my measurements for my materials were done with a digital scale where I could control how much of each ingredient I was using down to the nearest milligram. I additionally used two of them, in case one were to malfunction or give a different result. Therefore, I know that I did not have any false readings or amounts or yeast, sugars, or distilled water. Unless, of course, both digital apparatuses malfunctioned.
I repeated my method four times with each sugar to increase reliability and make sure I was getting consistent results. Additionally, when a trial went wrong in any way, I would clean up and re-do it. For example, one time I realized that I had labelled my flask incorrectly and lost track of which sugar I had put in the solution. I properly disposed of it, cleaned the materials, and started over to ensure that I was being accurate, and no leftover waste or excess ingredients would affect the results i.e. each experiment would be independent from one another.
3.4 Risk Assessment
Safety issues: None of the materials I used were harmful or put me at risk in any way.
Ethical issues: Nothing in my internal assessment could be deemed unethical in any way. Environmental issues: The disposal of yeast in a drainage or water system can result in adecrease of oxygen for anything that is further down the pipes. This oxygen shortage can throw off the balance of any ecosystems associated with the drain in question. Thus, I diluted the yeast mixture with water and then disposed of it in the waste container.
Raw and Processed Data
4.1 Qualitative Observations
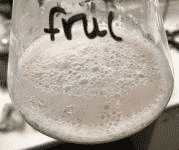
- The saccharide mixture combined with the yeast started to create a layer of froth/bubbles at the top.
- The mixture previously mentioned also left condensation all over the inside of the flask.
- Some sugars were harder to dissolve in the distilled water than others, namely the fructose. This is most likely due to the more complex structure that makes it harder to mingle with the H2O. The more monomers and bonds within a compound, the more difficult it is for any other molecule, in this case water, to interfere and dissolve it.
4.2 Raw Data
| Saccharide | 15 minutes/cm3 | 30 minutes/cm3 | ||
| Glucose | 51 | 94 | ||
| 63 | 108 | |||
| 48 | 99 | |||
| 51 | 97 | |||
| Sucrose | 14 | 17 | ||
| 13 | 19 | |||
| 17 | 26 | |||
| 63 | 86 | 8 | ||
| Fructose | 55 | 110 | ||
| 45 | 72 | |||
| 36 | 69 | |||
| 50 | 96 | |||
| Lactose | 18 | 21 | ||
| 15 | 21 | |||
| 10 | 17 | |||
| 15 | 19 |
4.3 Processed Data
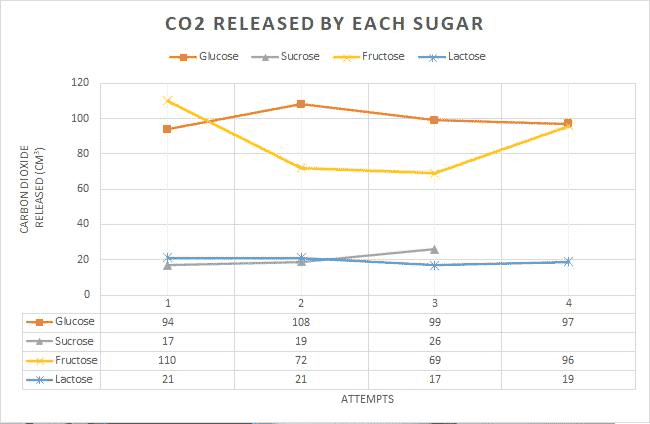
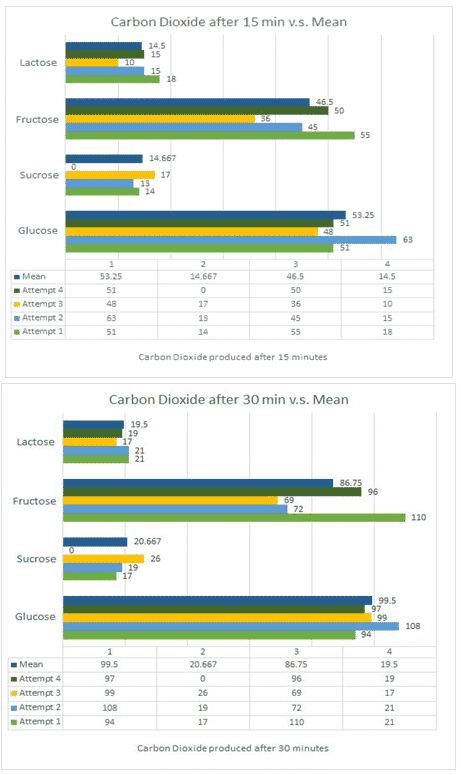
From this graph, we can very well see that some sugars simply performed better, specifically glucose and fructose. The disaccharides – fructose and lactose – had a much lower fermentation rate. Thus, my hypothesis is being supported.
| Saccharide | 15 min mean | 15 min standard dev. | 30 min mean | 30 min standard dev. |
| (cm3) | (cm3) | |||
| Glucose | 53.25cm3 | 5.760 | 99.5cm3 | 5.220 |
| Sucrose | 14.667cm3 | 1.700 | 20.667cm3 | 3.859 |
| Fructose | 46.5cm3 | 7.018 | 86.75cm3 | 17.020 |
| Lactose | 14.5cm3 | 2.872 | 19.5cm3 | 1.658 |
Had I not discarded the anomalies present in my raw data for sucrose, the standard deviations would have been over 5x as large. Because standard deviation is the value describing how much the data differs from the mean, it is very evident that such a large change in the value all due to one anomaly was unnecessary in my final conclusions and analysis of data. It would have negatively impacted the scope of my investigation because it is very obviously due to an error in my method (see weaknesses).
Evaluation
5.1 Conclusion
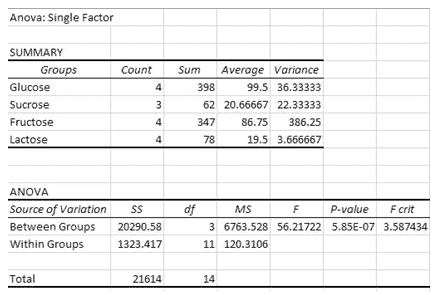
Looking at table 3 and graph 1, the hierarchy of efficacy in producing carbon dioxide reads as follows; glucose, fructose, sucrose, and lactose. When speaking in terms of standard deviation, sucrose and lactose had the smallest. Table 4 further supports this. Thus, sucrose and lactose were the most consistent and differed the least from their mean. This could be due to the substances being stored correctly or never having been disrupted since their extraction from the lab they were bought from. From table 4, we can further infer that since the F value is greater than the F crit value, the values are not at all equal, rejecting my null hypothesis.
A higher standard deviation, as seen in fructose, could be a result of improper care of the sugars themselves. For example, placing them in warm temperatures or letting them be vulnerable to sunlight could cause them to melt or change in structure and thus alter from molecule to molecule.
Regarding other academic investigations of yeast, my investigation gave results that were expected by other biologists. To quote from the Journal of Undergraduate Biology Laboratory Investigations, “The monosaccharides we used in our experiments (glucose and honey)produced a higher rate of CO2 than the disaccharides (refined sucrose and lactose) did.” This directly aligns with my alternative hypothesis and experiment results.
From my results, it can be concluded that yeast is affected differently depending on the type of saccharide it encounters. Thus, it supports my hypothesis: Glucose will produce the largest
amount of carbon dioxide, followed, by fructose, sucrose, and lactose. As mentioned before, their chemical formulas being almost identical has little to do with it. It is all in the structure. The monosaccharides require less energy to be broken down and thus create the product of carbon dioxide. This is proven by the fact that every cell has the ability to break down glucose, whereas only the liver can break down fructose.9 Even then, when breaking down fructose, it is first converted into glucose where then glycolysis can take place.
5.2 Improvements
The apparatus I used was not optimal. For example, my mixer did not have a digital display of how fast my rpm was. Thus, I could have been mixing the yeast and sugar solutions at different speeds for each trial. The speed could have affected the rate of the reaction due to how well the molecules were interacting and colliding with each other, and thus affecting the production of carbon dioxide.
In addition, I used quite a large flask compared to the 50ml of solution I had to use. It was made for 250ml, so it is imaginable how much extra space was within the container. This may have decreased the accuracy of the measurements I took from the gas syringe, because there was also gas trapped in the flask itself. Perhaps I could have additionally measured the volume of the container that did not have the solution (the gap between the liquid surface and the gas syringe) and added that to my volumetric values of carbon dioxide to increase my accuracy.
Finally, the yeast packages I used were all from the same store, however it is possible that they were sourced from different farms. Therefore, the structure of the yeast molecules used could have differed due to different methods used while they were farmed. Albeit, this would be a very difficult, arbitrary thing to track, and is a stretch in affecting the results of my assessment.
What my investigation did do extremely well was independence. It is extremely unlikely that and ingredients unintentionally mixed or met due to my rigorous cleaning and replacing of the apparatus. In addition, my method of using the mixer was helpful because it ensured the solutions were extremely even and constant throughout (e.g., no leftover sugar at the bottom).
5.3 Extensions
To extend the current scope of my study, I would be enthusiastic to try and see how different types of yeast would affect my results. In this internal assessment, I only used brewers/baker’s yeast that is simply dried from a farm. However, there are hundreds of other kinds found in a variety of different places. I would measure how these saccharides, and possibly also more, e.g. maltose, affect the fermentation rate of yeasts like torula (used to create paper) and fission yeast (alternative to brewing yeast) or fresh yeast.

