*Astronomers analyze light from objects in space in order to learn about the composition and movement of the objects.
After today’s lecture, you should be able to:
– Describe the characteristics of electromagnetic radiation.
– Explain ways of analyzing light in order to get information about stars.
– Explain the Doppler Effect and how it gives information about the motion of stars.
*Light is a form of electromagnetic radiation, which is energy that travels in waves.
The Electromagnetic Spectrum of Radiation
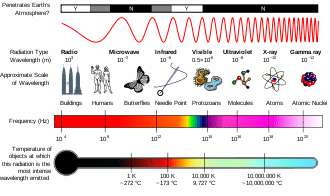
*There are several different forms of radiation.
-These are arranged on a spectrum by the size of their wavelengths, from longest to shortest
-A wavelength is the distance from 1 wave crest to the next wave crest.
Types of Radiation (from longest to shortest)
- Radio Waves = longest waves
*least energy (1000-1 m)
- Microwaves (10-1 – 10-4 m)
- Infrared (Heat) (10-4 – 10-6.5 m)
- Visible Light = ROYGBIV → Red (longest) to Blue (shortest) (10-6.5 – 10-7 m)
- Ultraviolet (10-7 – 10-8 m)
- X-Rays (10-8 – 10-11 m)
- Gamma Rays = shortest waves
*most energy (10-11 m and smaller)
*All of these travel at the speed of light!
The Spectroscope
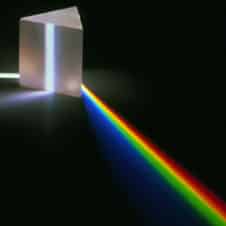
*White light = All colors of visible light
- Can be broken down into the visible spectrum using a spectroscope– a tool which uses a prism to separate light into its different colors!
- ROYGBIV = red, orange, yellow, green, blue, indigo, violet
- Spectrum can be used by astronomers to learn more about distant stars!
- Spectroscopes break light into 3 types of spectra:
Types of Visible Spectra
1) Continuous Spectrum
- Shows an unbroken band of the colors of the visible spectrum

- Indicates that its source is emitting light of all visible wavelengths.
- Source is a form of glowing solid, liquid, or compressed gas
- Examples: hot filament of an electric light; molten iron; compressed gas inside stars
2) Emission Spectrum
- Shows a series of unevenly spaced lines of different colors & brightnesses
- Indicates that the source is only emitting light of certain wavelengths.
- Used to identify elements found in the source object, since:
- Each element has its own unique emission spectrum! Like a fingerprint!
3) Absorption Spectrum
- Shows a continuous spectrum crossed by dark lines.
- This forms when light from a glowing object passes through a cooler gas- (Like that of its atmosphere or outer layers.)
- The lines represent the composition of the gas (or the star’s outer layers!)
- Comparing emission and absorption spectra, scientists can determine what elements are present in the cooler gas.
The SUN as an Example:
- Interior = hot, compressed gases = continuous spectrum
- Outer Layers = chromosphere & photosphere
- These are cooler than the interior.
- Absorb some electromagnetic radiation from the interior.
- Dark lines = elements in the outer layers!
*Absorption spectrum can also tell us about a planet’s atmospheric composition.
- Planets shine by reflecting light from the sun.
- Dark lines NOT found in the star’s (sun’s) spectrum are caused by elements in the planet’s atmosphere!
The Doppler Effect
*Example = A drop in pitch when a car races past.
- As the car approaches the wavelength of the sound waves decreases (becomes shorter) = higher pitch
- As the car moves away the wavelength of the sound waves increases (becomes longer) = lower pitch
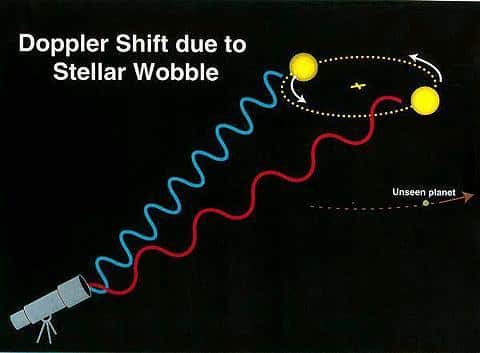
*The Doppler Effect = works the same way for both sound (as mentioned above) & light
- Light = Objects (ex.- star) moving toward
- Wavelengths become shorter =blueshift
- Light = Objects (ex.- star) moving away
- Wavelengths become longer = redshift
*By using this info., we can tell how objects in space are moving in relation to Earth!
