Introduction
In physics, any increase or decrease in velocity is referred to as acceleration or deceleration. The rate of acceleration is measured in m/s² or km/m/s respectively. The average acceleration of an object can be derived from the formula. This experiment, commonly known as the ticker timer experiment, involves analyzing the motion of a cart down a ramp using a ticker tape timer to gather data:

Purpose
The purpose of this ticker tape experiment is to identify the correlation between the movement of a cart and the appearance of the velocity-time graph. This correlation is then used to calculate the displacement and acceleration of the cart.
Materials
- Ramp
- Masking tape
- Recording tape
- Ruler
- Graph paper
- Loaded cart
- Ticker timer
- Power supply
Controlled Variable: The ramp, the timer, the cart releaser, the testing environment, length of ticker tape, the angle of the ramp
Independent Variable: The average velocity of the cart per interval
Dependent Variable: The total displacement of the cart
Method
1) A table was drawn to record time, displacement, and average velocity.
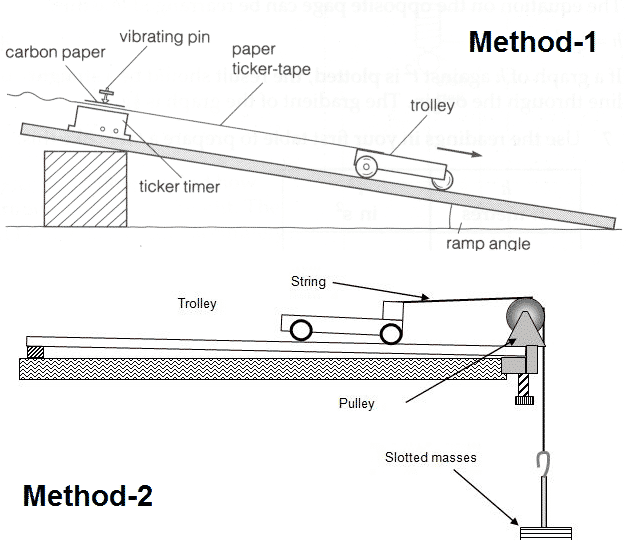
2) The ramp, recording timer, and cart were set up in the test environment.
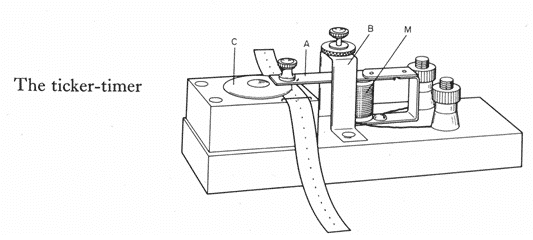
3) A length of recording tape was attached to the cart and threaded through the ticker timer.
4) The timer was started and the cart was released down the ramp so that the recording tape was pulled through the timer.
5) Steps 3 and 4 were repeated until each person in the group had a tape of the motion.6) The marking tape was analyzed by marking the starting dot t= 0 and dividing the tape into equal time intervals. Each six dot interval was .10s.
7) The displacements of each time interval were recorded in the table.
8) The average velocity was calculated and recorded for each time interval.
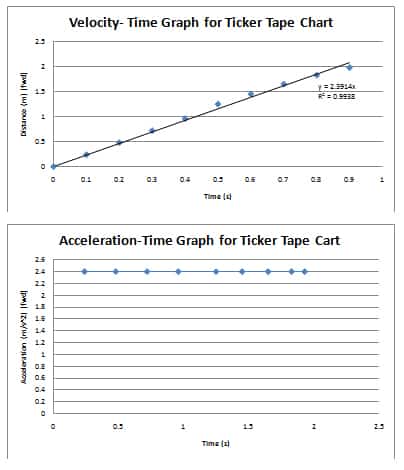
9) The graph of the velocity for the cart was plotted at the half-time intervals.
10) The line of best fit was drawn through the points.
11) The average acceleration of the cart was calculated by finding the slope of the velocity-time graph in m/s²
Observations
| Time Interval (s) +/- .05ms | Distance (cm) +/- .05mm |
| .10 | 2.35 |
| .20 | 7.10 |
| .30 | 12.1 |
| .40 | 16.9 |
| .50 | 23.6 |
| .60 | 24.8 |
| .70 | 28.5 |
| .80 | 30.5 |
| .90 | 32.3 |
Calculations
Average Velocity Per Interval
| Time Elapsed (s) | Distance per Interval (m) [fwd] | Average Velocity (m/s) [fwd] |
| .10 | 0.024 | 0.24 |
| .10 | 0.071 | 0.71 |
| .10 | 0.121 | 1.21 |
| .10 | 0.169 | 1.69 |
| .10 | 0.239 | 2.39 |
| .10 | 0.248 | 2.48 |
| .10 | 0.285 | 2.85 |
| .10 | 0.305 | 3.05 |
| .10 | 0.323 | 3.23 |
Average Velocity Overall (Total Displacement)
| Time Elapsed (s) | Total Distance (m) [fwd] | Average Velocity (m/s) [fwd] |
| .10 | 0.024 | 0.24 |
| .20 | 0.095 | 0.48 |
| .30 | 0.216 | 0.72 |
| .40 | 0.385 | 0.96 |
| .50 | 0.624 | 1.25 |
| .60 | 0.872 | 1.45 |
| .70 | 1.157 | 1.65 |
| .80 | 1.462 | 1.83 |
| .90 | 1.785 | 1.98 |
| Average Velocity for Entire Trip: 1.17 (m/s) [fwd] |
Average Change in Velocity (Acceleration)
| Time Interval (s) | Average Velocity (m/s) | Acceleration (m/s²) [fwd] |
| .10 | 0.24 | 2.4 |
| .20 | 0.48 | 2.4 |
| .30 | 0.72 | 2.4 |
| .40 | 0.96 | 2.4 |
| .50 | 1.25 | 2.4 |
| .60 | 1.45 | 2.4 |
| .70 | 1.65 | 2.4 |
| .80 | 1.83 | 2.4 |
| .90 | 1.93 | 2.4 |
| Average Acceleration for Entire Trip: 2.4m/s² |
Error Analysis
After performing the experiment four times there are several conclusions that can be drawn from it. The first of which being errors.
Equipment Error
During the experiment, there were difficulties that sometimes occurred with the ticker tape timer. Though the machine worked quite effectively the problem was encountered with the purple carbon disc that created imprints on the ticker tape paper.
During the experiment on two occasions, the disc would either not imprint anything on the ticker tape paper or come off during that experiment. This resulted in trials having to be repeated and the waste of lab materials to retrieve accurate data.
There’s always the potential for inherent errors during an experiment and this one is not an exception. The cart is released and the operation of the ticker tape timer was done by two different group members.
This created the possibility for the cart to be released slightly before or after the ticker tape timer was activated. Though it may not seem drastic because the time measurements being recorded are so minuscule, such a synchronization problem can significantly change in average velocities per interval.
Improvements
There are two major improvements that can be proposed to make the data collected from this experiment more precise and accurate.
Synchronization Tool: Develop a tool that allows one person to simultaneously operate the ticker tape timer and release the cart. This would ensure precise synchronization and more accurate data collection.
Guided Track: Add a groove to the ramp to guide the cart along a consistent path. This would minimize variations in the cart’s starting and ending positions, preventing it from falling off the ramp and ensuring uniform motion.
Conclusion/ Discussion
Average Velocity Calculation: The average velocity for an interval can be found by determining the slope of that interval. The tangent or midpoint method can be used to find the rise/run to give you the average velocity.
Constant Acceleration: For constant acceleration, the average velocity for an interval equals the instantaneous velocity at the half-time of the interval.
Velocity-Time Graph: The average velocity for an interval on a velocity-time graph must be plotted at a specific point to represent instantaneous velocity.
Graph Shape: If the acceleration is constant, the velocity-time graph will be linear. Positive deviation in acceleration results in a curved or parabolic graph.
Non-Uniform Motion: Based on the data, the cart experienced non-uniform motion.
Average Acceleration: The average acceleration of the cart was calculated to be 2.4 m/s² or 240cm/s².
Displacement Correlation: The area under each interval of the velocity-time graph was relatively equal to the displacement of the cart for that interval. It should however be exactly the same as the displacement of the cart at the interval. Variations may occur due to rounding during calculations.

Creating Graphs from Data
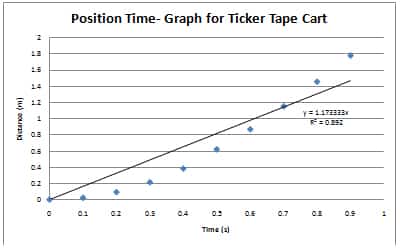
- Velocity-Time Graph from Position-Time Graph: Divide the displacement of each interval by the time of each interval to get the average velocity. Plot this as the dependent variable against time.
- Position-Time Graph from Velocity-Time Graph: Find the average velocity for each interval (this can be done by finding the slope of each interval). multiply each average velocity by its time interval to get the displacement. Then plot each displacement value in accordance with its time interval on a position-time graph.
- Acceleration-Time Graph from Velocity-Time Graph: Calculate the slope of each interval, then plot the average acceleration value with its appropriate time interval.
- Velocity-Time Graph from Acceleration-Time Graph: Multiply the average acceleration by the time interval to get average velocity, then plot with its corresponding time interval.
Conclusion
The ticker tape experiment demonstrated uniform acceleration with a constant magnitude of 2.4 m/s² down the ramp. The velocity-time graph of the cart showed a relatively linear shape, indicating consistent acceleration. Displacement was determined by finding the area under the velocity-time graph, while acceleration was found by calculating the slope of the line. Despite minor errors, the experiment was conducted smoothly, and the data collected was accurate. However, implementing the proposed improvements could enhance the precision of future experiments.
Valid Statistics and Facts
- Ticker Timer Precision: Ticker timers typically imprint dots at a rate of 50 or 60 dots per second, providing high-resolution data for analyzing motion.
- Historical Context: The ticker tape experiment has been a staple in physics education since the early 20th century, offering a hands-on approach to understanding kinematics.
- Educational Value: This experiment aligns with grade 11 physics curricula and ticker timer experiment grade 11 answers, reinforcing concepts of acceleration, velocity, and graph interpretation.
The ticker tape lab is an effective experiment for understanding motion, velocity, and acceleration. Follow this experiment for ticker timer experiment grade 11 answers. By addressing equipment and inherent errors, and implementing improvements, students can gain precise and reliable data. This hands-on approach not only reinforces theoretical knowledge but also enhances practical skills in scientific experimentation.


Hypothesis?
This helped so much with my assignment. Thank u very much
Descriptive and very helpful , i had to recommend this site to all my friends who do physics
totally agree with you udashil, great site
relationship between instantaneous velocity and average velocity?
Wow this really helped soooo much with my assignment!
Wow, wow, wow! Awesome! Now I know what to write and how to put it in plain English hmmm so happy. Thank you! It really helped me in my assignment.
Wow, i totally read all of this and it really helped me!
There are two sets of data; one referring to each interval and one to the overall distance.
ok i need to know whether when measuring the ticker tape you add the first 6 dots into the d2’s six dot, is d2=d2+d1 or the six dot ahead of d1
This helped me out soooo much with my first formal project. We did the experiment briefly in class and then we were assigned to do it over Easter break. Of course, i put it off for a while thinking it was easy and that i could get away with doing it quickly, but this made me see how much depth you can go into with explaining and graphs and everything! It didnt help me in the sense of cheating but it helped me understand. Thank you so much! 🙂
I don’t know how to calculate they say calculate the acceleration for the 30degree slope please show me the steps and answer