| Species A | Species B | Species C |
| 11 | 21 | 31 |
| 12 | 21 | 37 |
| 13 | 22 | 40 |
| 15 | 18 | 44 |
| 16 | 18 | 43 |
| 12 | 25 | 42 |
| 15 | 27 | 40 |
| 17 | 29 | 42 |
| 16 | 20 | 30 |
| 15 | 26 | 38 |
Calculate the Shannon’s Diversity Index along with the Simpson’s Diversity Index for Species A, Species B and Species C respectively then state which species is more diverse and explain why it is more diverse.
CALCULATIONS
SPECIES A
A) Shannon – Weiner Index
H1=[NlnN-∑(ni ln ni)]/ N
where N is the total number of species and ni is the number of individuals in species.
For species A
N=11+12+13+15+16+12+15+17+16+15=142
For species A
| Species A |
| ni=11 |
| ni=12 |
| ni=13 |
| ni=15 |
| ni=16 |
| ni=12 |
| ni=15 |
| ni=17 |
| ni=16 |
| ni=15 |
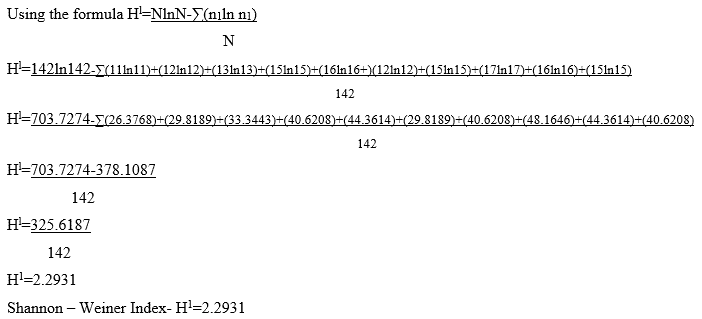
B) SIMPSON’ DIVERSITY
Species A
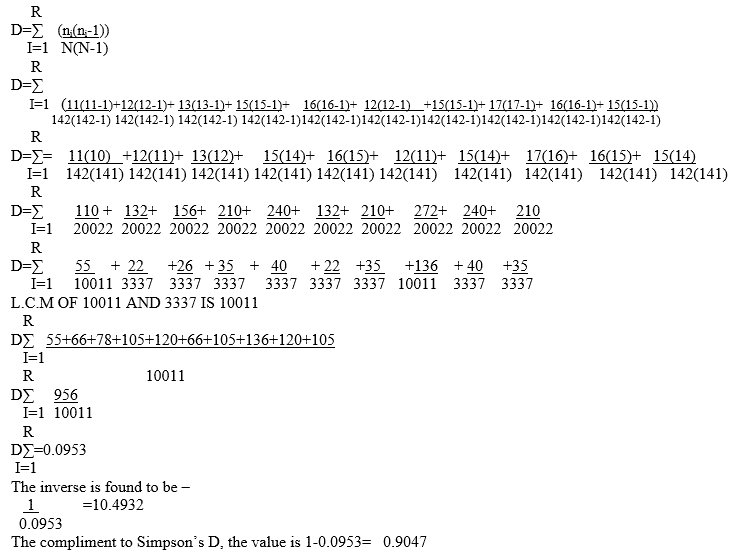
N is the total number of species in the sample and ni is the total number of individual species .
From the above calculation N is equal to 142 and ni is shown in the table below-
| Species A |
| ni=11 |
| ni=12 |
| ni=13 |
| ni=15 |
| ni=16 |
| ni=12 |
| ni=15 |
| ni=17 |
| ni=16 |
| ni=15 |
SPECIES B
a) Shannon – Weiner Index
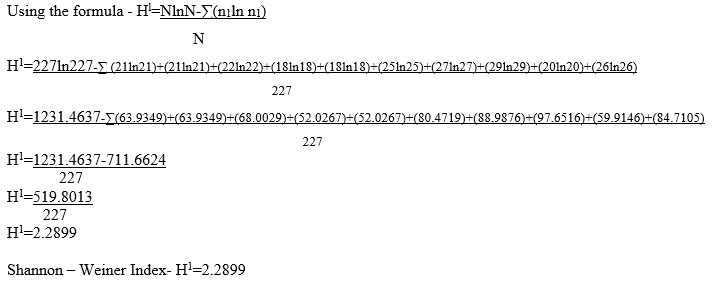
H1=NlnN-∑(ni ln ni)/ N
where N is the total number of species and ni is the number of individuals in species.
For Species b N=21+21+22+18+18+25+27+29+20+26=227
| Species B |
| ni=21 |
| ni=21 |
| ni=22 |
| ni=18 |
| ni=18 |
| ni=25 |
| ni=27 |
| ni=29 |
| ni=20 |
| ni=26 |
SPECIES B
SIMPSON’ DIVERSITY
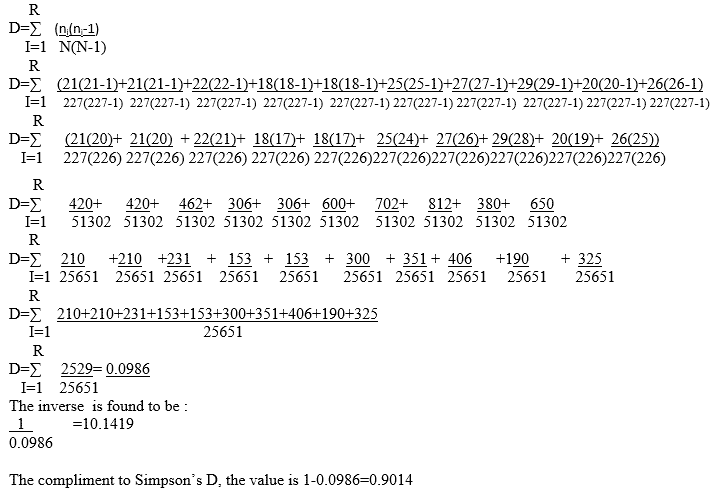
b) N is the total number of species in the sample and ni is the total number of individual species.
From the above calculation N is equal to 227 and ni is shown in the table below-
| Species B |
| ni=21 |
| ni=21 |
| ni=22 |
| ni=18 |
| ni=18 |
| ni=25 |
| ni=27 |
| ni=29 |
| ni=20 |
| ni=26 |
SPECIES C
a) Shannon – Weiner Index
H1=NlnN-∑(ni ln ni)/ N
where N is the total number of species and ni is the number of individuals in species.
For species c N =31+37+40+44+43+42+40+42+30+38=387
| SPECIES C |
| ni=31 |
| ni = 37 |
| ni =40 |
| ni =44 |
| ni =43 |
| ni =42 |
| ni =40 |
| ni =42 |
| ni =30 |
| ni =38 |
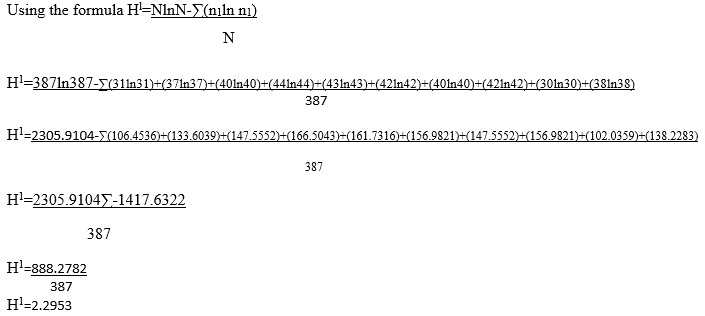
SPECIES C
b) SIMPSON’ DIVERSITY
N is the total number of species in the sample and ni is the total number of individual species.
I have found N to be 387 from the above the calculation.
| SPECIES C |
| ni=31 |
| ni = 37 |
| ni =40 |
| ni =44 |
| ni =43 |
| ni =42 |
| ni =40 |
| ni =42 |
| ni =30 |
| ni =38 |

The compliment to SIMPSONS D, the value is –
1-0.092=0.908
Species A is more diverse .
The value of Simpson’s D ranges from 0 to 1, with 0 representing infinite diversity and 1 representing no diversity, so the larger the value of D , the lower the diversity. For this reason, Simpson’s index is usually expressed as its inverse (1/D) or its compliment (1-D).
Using the inverse, the value of this index starts with 1 as the lowest possible figure. The higher the value of this inverse index the greater the diversity.
The higher value of the inverse index is species A which is 10.4932
Therefore the more diverse species is species A.
